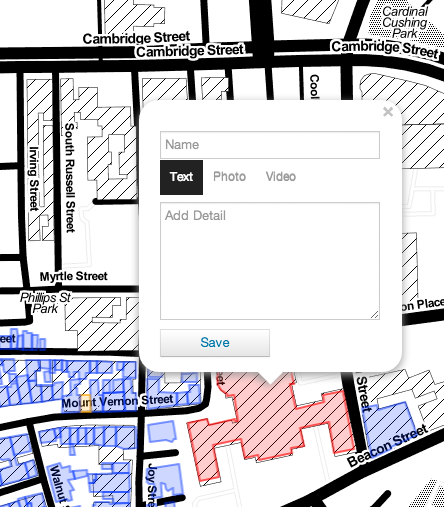
Majuro.JS helps you make detailed, interactive maps with open buildings data.
It's free and open source.
It couldn't be easier
Draw a neighborhood.
Drag points on the blue shape to cover any part of the city.

Drop markers to color-code buildings.
Click a building to add a photo or description.


Your custom map is saved here on MajuroJS.org.
-
Data for Download
Download your map for Google Earth and other programs in KML or GeoJSON format.

Data Visualization
With a GitHub account, you can set up your own website based on MajuroJS GitHub Pages, which include several maps and visualizations.
Cities with time information (Chicago and Midland) can make timelines and time-clusters.
No projections, time series tools, or geoprocessing. Just data that works.
We let you take advantage of our Google Adwords reporting platform, without interfering with your work, if you don't want us to.
Cities
You can download buildings in 21 cities, towns, and counties!
Some sources include addresses, build dates, and height of buildings.
|
Buildings data was collected under open data licenses. There is no official endorsement or maintenance of this site by these cities, towns, and counties.
Examples
Habitat for Humanity in Bibb County, GA
Buildings data illustrated the impact that Habitat for Humanity has had in their neighborhood. Houses were marked green (for renovations), red (for demolitions), or orange (unchanged).
The final map was presented at a Code for America event at Mercer University's Center for Collaborative Journalism.
Historic Chicago
At an OpenGov Hack Night, Historic Chicago was born. Instant timeline maps show when buildings in your neighborhood were built.

An updated version is available by selecting 'timeline' on majurojs.org/draw/chicago
Recent Maps
You can see up to 20 maps made in the last 24 hours on the Recent Regions Page.
FAQ
How can I use the data?
A popup on each map links to the data's source and the local government's data policy.
If you have questions or need the data for anything mission-critical, ask the local government directly.
What if my city isn't included?
Reach out to your city and county GIS departments. It's possible that they may not have buildings data, or that one may have better data than the other.
If you get permission to publish the data freely on this site, please have an official send a written data policy.
Why would a city or county share their data on MajuroJS.org?
MajuroJS.org is a platform for officials, community leaders, student volunteers, and others to illustrate their neighborhoods, their work, and their plans on the web. For the people who trying to change their neighborhoods, it is a huge leap to get the detailed, comprehensive maps from the local government.
Publish your data on a site accessible and usable by citizens, without taxing your own website or technical support teams.
Does the site work with Internet Explorer?
All saved and finished maps should work with Internet Explorer 7 and above - this makes your maps available to most local government officials.
In the map editor, a color change control appears in place of the drag & drop editor. Direct KML and GeoJSON downloads are unavailable until after you save your map.
How do I add my data?
Send a shapefile, KML, or a link to a page from your city's open data site.
Is this open source?
The entire site is open source. Source code on GitHub
The background map (and the image at the top of this page) use data from OpenStreetMap.
Can I map a whole city with this?
Maps on Majuro.js are vector-based, so several hundred or thousands of buildings can slow down web browsers.
For large projects, try downloading the data as KML, then upload it to CartoDB and edit it through NeighborDiff.
How did this project get started?
I am Nick Doiron, @mapmeld on Twitter and GitHub. Majuro.js is based on projects that I made for the City of Macon, GA during my Code for America fellowship, particularly: GeoData Checkout and NeighborDiff.


